微信小程序图表插件(wx-charts)的介绍
这篇文章主要介绍了微信小程序图表插件(wx-charts)实例代码,具有一定的参考价值,感兴趣的小伙伴们可以参考一下。
微信小程序图表工具,charts for WeChat small app
基于canvas绘制,体积小巧
支持图表类型
饼图 pie
圆环图 ring
线图 line
柱状图 column
区域图 area
代码分析 Here
参数说明
opts Object
opts.canvasId String required 微信小程序canvas-id
opts.width Number required canvas宽度,单位为px
opts.height Number required canvas高度,单位为px
opts.title Object (only for ring chart)
opts.title.name String 标题内容
opts.title.fontSize Number 标题字体大小(可选,单位为px)
opts.title.color String 标题颜色(可选)
opts.subtitle Object (only for ring chart)
opts.subtitle.name String 副标题内容
opts.subtitle.fontSize Number 副标题字体大小(可选,单位为px)
opts.subtitle.color String 副标题颜色(可选)
opts.animation Boolean default true 是否动画展示
opts.legend Boolen default true 是否显示图表下方各类别的标识
opts.type String required 图表类型,可选值为pie, line, column, area, ring
opts.categories Array required (饼图、圆环图不需要) 数据类别分类
opts.dataLabel Boolean default true 是否在图表中显示数据内容值
opts.dataPointShape Boolean default true 是否在图表中显示数据点图形标识
opts.xAxis Object X轴配置
opts.xAxis.disableGrid Boolean default false 不绘制X轴网格
opts.yAxis Object Y轴配置
opts.yAxis.format Function 自定义Y轴文案显示
opts.yAxis.min Number Y轴起始值
opts.yAxis.max Number Y轴终止值
opts.yAxis.title String Y轴title
opts.yAxis.disabled Boolean default false 不绘制Y轴
opts.series Array required 数据列表
数据列表每项结构定义
dataItem Object
dataItem.data Array required (饼图、圆环图为Number) 数据
dataItem.color String 例如#7cb5ec 不传入则使用系统默认配色方案
dataItem.name String 数据名称
dateItem.format Function 自定义显示数据内容
Example
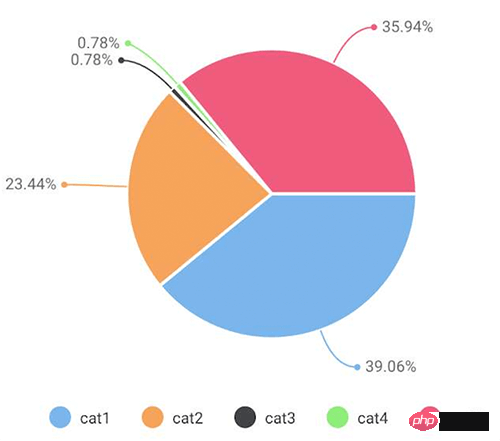
pie chart
var wxCharts = require('wxcharts.js');new wxCharts({ canvasId: 'pieCanvas', type: 'pie', series: [{name: 'cat1',data: 50, }, {name: 'cat2',data: 30, }, {name: 'cat3',data: 1, }, {name: 'cat4',data: 1, }, {name: 'cat5',data: 46, }], width: 360, height: 300, dataLabel: true});
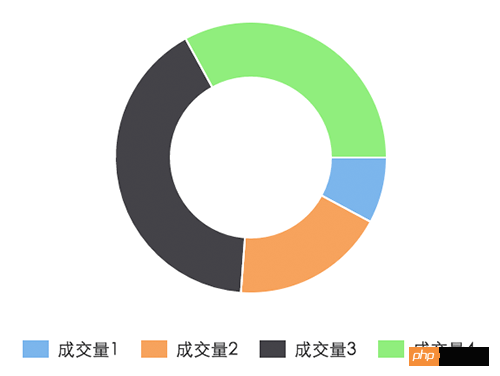
ring chart
new wxCharts({ canvasId: 'ringCanvas', type: 'ring', series: [{name: '成交量1',data: 15, }, {name: '成交量2',data: 35, }, {name: '成交量3',data: 78, }, {name: '成交量4',data: 63, }], width: 320, height: 200, dataLabel: false});
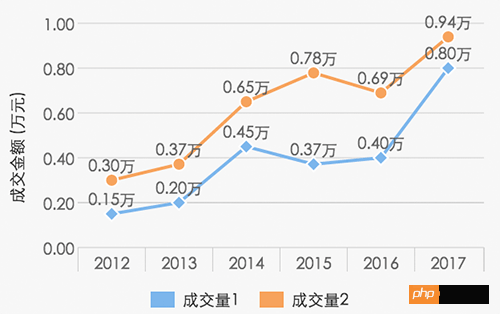
line chart
new wxCharts({ canvasId: 'lineCanvas', type: 'line', categories: ['2012', '2013', '2014', '2015', '2016', '2017'], series: [{name: '成交量1',data: [0.15, 0.2, 0.45, 0.37, 0.4, 0.8],format: function (val) {return val.toFixed(2) + '万';} }, {name: '成交量2',data: [0.30, 0.37, 0.65, 0.78, 0.69, 0.94],format: function (val) {return val.toFixed(2) + '万';} }], yAxis: {title: '成交金额 (万元)',format: function (val) {return val.toFixed(2);},min: 0 }, width: 320, height: 200});

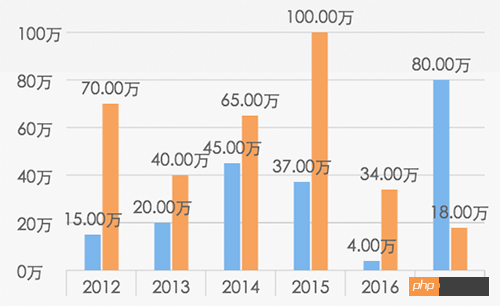
columnChart
new wxCharts({ canvasId: 'columnCanvas', type: 'column', categories: ['2012', '2013', '2014', '2015', '2016', '2017'], series: [{name: '成交量1',data: [15, 20, 45, 37, 4, 80] }, {name: '成交量2',data: [70, 40, 65, 100, 34, 18] }], yAxis: {format: function (val) {return val + '万';} }, width: 320, height: 200});
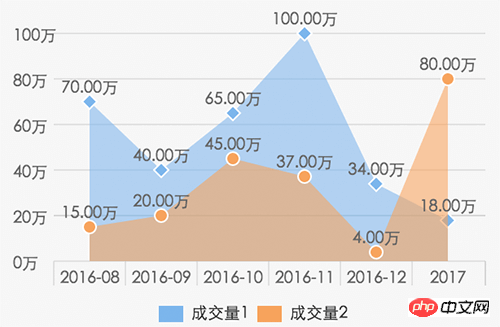
areaChart
new wxCharts({ canvasId: 'areaCanvas', type: 'area', categories: ['2016-08', '2016-09', '2016-10', '2016-11', '2016-12', '2017'], series: [{name: '成交量1',data: [70, 40, 65, 100, 34, 18],format: function (val) {return val.toFixed(2) + '万';} }, {name: '成交量2',data: [15, 20, 45, 37, 4, 80],format: function (val) {return val.toFixed(2) + '万';} }], yAxis: {format: function (val) {return val + '万';} }, width: 320, height: 200});

以上就是本文的全部内容,希望对大家的学习有所帮助,更多相关内容请关注PHP中文网!
相关推荐:
微信小程序表单验证错误提示效果
微信小程序中tabBar底部导航的介绍
以上就是微信小程序图表插件(wx-charts)的介绍的详细内容,更多请关注小潘博客其它相关文章!